

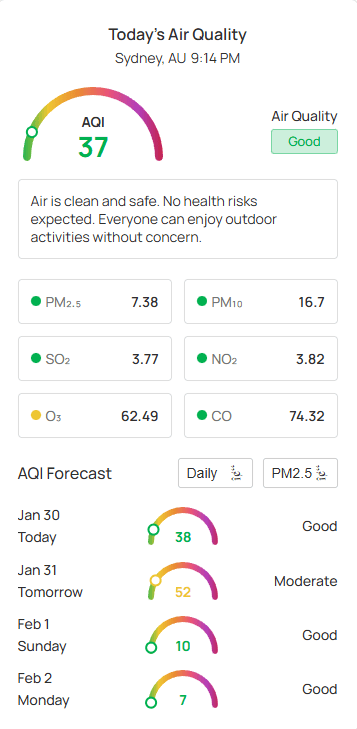
Display real-time air quality data— including the Air Quality Index (AQI), key AQI pollutants, and health advisories in a clean, compact layout. Use the AQI – Minimal Card to present essential environmental health information at a glance, perfectly suited for sidebars or in-page content without disrupting your design.
AQI – Minimal Card Block – Key Features:
- Real-time Air Quality Data: Display current AQI levels and primary pollutant information.
- Stylish Templates: Choose from 6 pre-designed templates to match your site’s aesthetic.
- Pollutant Details: Provide specific data on pollutants with customizable display styles.
- Health Advisory: Include actionable health recommendations based on current air quality.
- Comprehensive AQI Forecast: Support for Daily, Hourly, or combined air quality AQI forecasts in multiple view styles.
- Responsive Display: Fully optimized for seamless viewing on desktop, tablet, and mobile devices.
How to Create a Minimal AQI Card Block
- Open the WordPress page or post you wish to edit.
- Click the (+) button to add a new block.
- Search for “AQI – Minimal Card” or find it under the Location Weather blocks.
- Click the block to add it to your page. You can instantly see the Block Preview to customize as you want.
- Once you’ve done the design, click Publish or Update.
Let us explore the AQI – Minimal Card Block Settings:
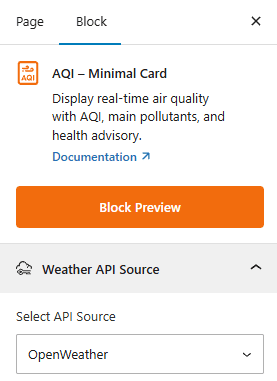
Weather API Source
API Source: This section allows you to select the Weather API provider for your air quality information. Choose your preferred provider, OpenWeather or Weather API ( Upcoming), to fetch accurate data.
AQI Templates: General
This section provides a variety of pre-designed templates and core search functionality.
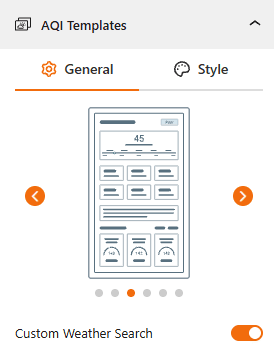
- Select a Template: Find your preferred templates from 6 stylish designs.
- Custom Weather Search: Use this toggle to enable a front-end weather search bar, allowing users to look up air quality for different locations.
Style AQI Templates:
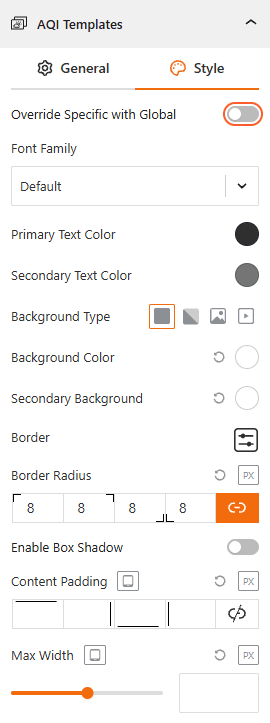
- Override Specific with Global: Toggle this to choose between global font styles and block-specific customizations.
- Typography: Dedicated panel to choose a custom Font Family as you need.
- Color: Set the Primary/Secondary Text Color from here.
- Background Type: Choose from Solid Color, Gradient, Image, or Video backgrounds to set the tone for your card.
- Border & Radius: Customize the border style and set a Border Radius to create modern, rounded corners.
- Show/Hide Box Shadow: Use the toggle to enable or disable the box shadow from here.
- Spacing & Width: Adjust the padding and Max Width to ensure the card fits perfectly in your layout.
Set Location:
This section allows you to define the geographic location for which the weather information will be displayed. For more details, visit this link.
Regional Preferences:
This section allows you to set the display format for the weather location name, time, and date, as well as the time zone and language. For more details, visit this link.
Air Quality Summary: General
This section allows you to configure and style the main descriptive elements of the air quality report within the block.
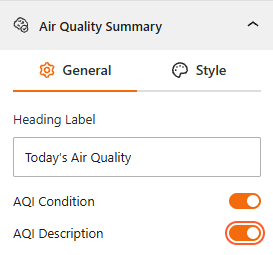
- Heading Label: Enter a custom title for the summary section (e.g., “Today’s Air Quality”).
- Show/Hide AQI Condition: Enable this toggle switch to show or hide the descriptive air quality status (e.g., Good, Moderate, Unhealthy).
- Show/Hide AQI Description: Enable this to display a detailed health recommendation or advisory based on the current air quality level.
Style Air Quality Summary:
To add style to your Air Quality Summary, follow the steps below.
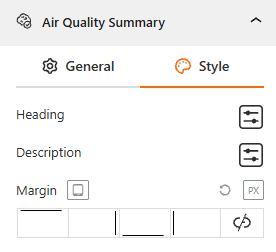
- Heading Typography: Customize the font family, color, size, weight, and style for the AQI heading.
- Description Typography: Customize the font family, color, size, weight, and style for the AQI description.
- Margin: Adjust the spacing around the summary section to ensure it fits well.
Pollutant Details: General
The Pollutant Details panel gives you complete control to fine-tune how specific pollutant data is presented to your visitors, ensuring technical accuracy and visual clarity.
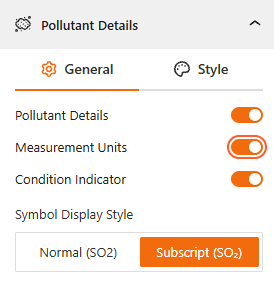
- Show/Hide Pollutant Details: Enable or disable this to show or hide the breakdown of individual pollutants.
- Show/Hide Measurement Units: Enable or disable the visibility of the units of measurement (e.g., $\mu g/m^3$) next to the pollutant values.
- Show/Hide Condition Indicator: Enable this to show a visual status for each pollutant.
- Symbol Display Style: Choose how chemical symbols appear:
Normal: Set it to display symbols as standard text (e.g., SO2).
Subscript: Set it to display symbols with a scientific formatting (e.g., $SO_2$).
Style Pollutant Details:
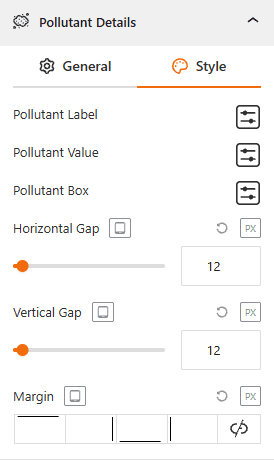
- Pollutant Label & Value Typography: Customize the font family, color, size, weight, and style as you want.
- Configure Pollutant Box: Set the background style, color, width & padding.
- Gap Controls: Adjust the Horizontal and Vertical Gap between the pollutant information boxes.
- Margin: Set custom margins to control the spacing between the pollutant section and other block elements.
Air Quality Forecast: General
From this panel, you can set how you want to show users upcoming air quality forecast trends, helping them plan outdoor activities accordingly.
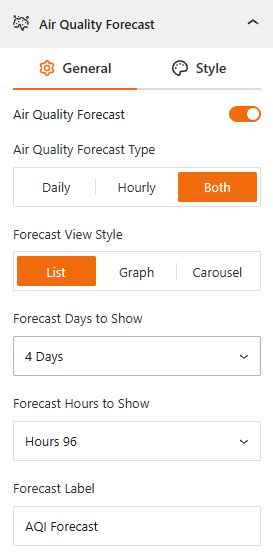
- Air Quality Forecast: Enable this toggle to enable or disable the forecast section.
- Air Quality Forecast Type: Select how to display Daily, Hourly, or Both forecast data.
- Forecast View Style: Choose the layout format from List, Graph, or Carousel.
- Display Range: Set the specific number of Forecast Days (e.g., 4 Days) or Forecast Hours (e.g., 96 Hours) to show.
- Forecast Label: Enter the title of the forecast section (default: “AQI Forecast”).
Style Air Quality Forecast:
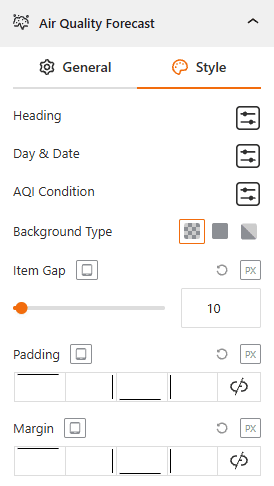
- Typography: Customize the font family, color, size, and weight for the Heading, Day & Date, and AQI Condition text.
- Background Type: Choose a background style for the forecast area (Transparent, Solid, or Gradient).
- Border & Radius: Customize the border style and set a border radius to create modern, rounded corners.
- Carousel Settings: Set the carousel settings as you want from here.
- Spacing: Adjust the Item Gap, Padding, and Margin from here.
Footer:
This section allows you to control the display of information in the block’s footer, such as the data update time and weather attribution. For more details, visit this link.
Advanced Settings:
This section allows you to control the visibility of the block across different device types. You can choose to show or hide the block on desktops, tablets, or mobile devices to optimize the user experience for each screen size. For more details, visit this link.