
If you’ve ever glanced at a weather app and seen a number like “AQI: 142 — Unhealthy for Sensitive Groups,” you might have wondered: what does that actually mean? What’s in the air? Who decides that number? And should you be worried?
Air quality is one of the most important — and least understood — factors affecting daily health. The terminology around it can feel like alphabet soup: PM2.5, NO₂, O₃, TVOC, NowCast, IAQI. Each term represents something real and measurable in the air around you right now.
This is your complete reference guide. Every major AQI term, every pollutant, every related concept — explained in plain language, in one place.
Part 1: The Core — What Is AQI?
Air Quality Index (AQI)
The Air Quality Index is a standardized numerical scale used by environmental agencies worldwide to communicate how clean or polluted the outdoor air is, and what health effects might be of concern. It was developed by the U.S. Environmental Protection Agency (EPA) and has since been adapted by countries around the world.
The AQI translates complex measurements of multiple air pollutants into a single, easy-to-understand number on a scale from 0 to 500. The higher the number, the more polluted the air, and the greater the potential health risk.
Think of it as a unified yardstick: instead of trying to understand what 35.4 µg/m³ of PM2.5 means for your health, the AQI converts that concentration into a number and color-coded category that anyone can immediately understand.
How the AQI is calculated
The AQI is not a simple average. It calculates a separate sub-index for each major pollutant being measured, then reports the highest of those sub-indices as the final AQI value. The formula is:
AQI = max(I_PM2.5, I_PM10, I_O₃, I_NO₂, I_SO₂, I_CO)
This means the AQI always reflects the worst pollutant in the air at that moment — not a blend of all of them. One badly elevated pollutant will define the day’s AQI regardless of how clean the others are.
Important: The AQI scale is non-linear. An AQI of 300 does not mean the air is twice as harmful as an AQI of 150. The relationship between concentration and health risk is complex, and the index reflects that complexity.
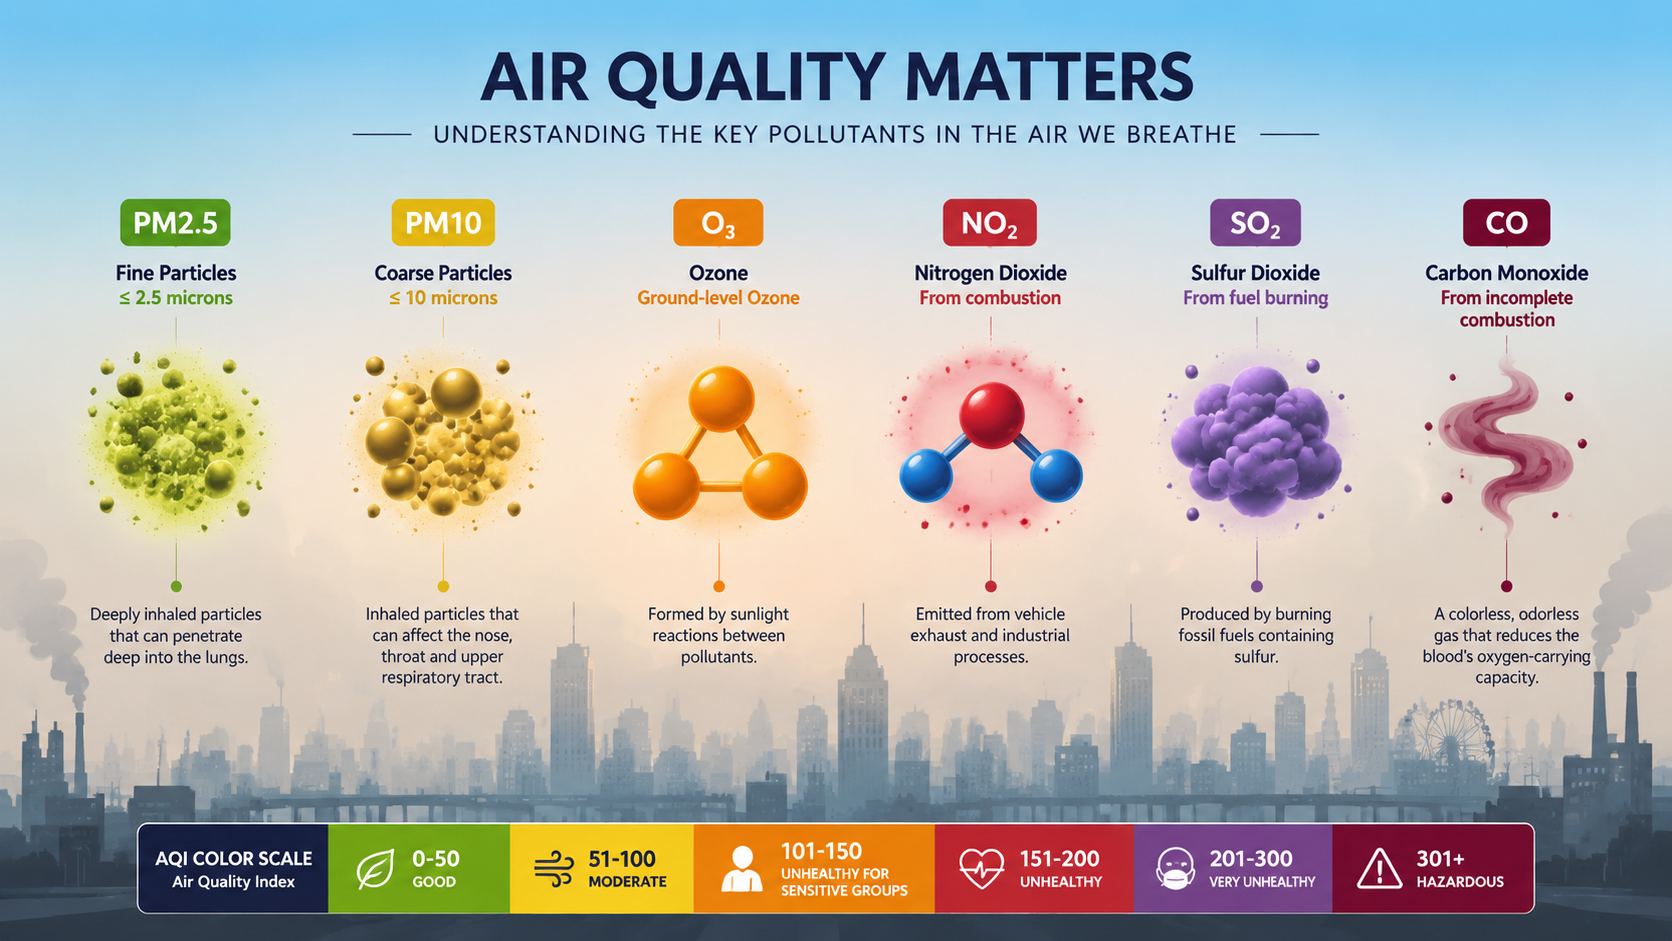
The Six AQI Categories
| Color | Category | AQI Range | Who Is Affected |
|---|---|---|---|
| 🟢 Green | Good | 0–50 | No risk. Safe for everyone. |
| 🟡 Yellow | Moderate | 51–100 | Acceptable. Unusually sensitive people may be affected. |
| 🟠 Orange | Unhealthy for Sensitive Groups | 101–150 | Sensitive groups at risk. General public less likely affected. |
| 🔴 Red | Unhealthy | 151–200 | Everyone may experience health effects. |
| 🟣 Purple | Very Unhealthy | 201–300 | Health alerts issued. Serious effects for everyone. |
| 🟤 Maroon | Hazardous | 301–500 | Emergency conditions. Entire population at risk. |
Beyond the AQI (500+)
On extremely rare occasions during catastrophic events (major wildfires, industrial accidents), AQI values may exceed 500. These are designated “Beyond the AQI” and the Hazardous category recommendations apply.
Sub-Index (Individual AQI / IAQI)
Each pollutant measured gets its own sub-index — sometimes called an Individual AQI (IAQI) — calculated independently using that pollutant’s specific breakpoint table. The sub-index converts a raw concentration measurement into a number on the 0–500 AQI scale.
When you see an app showing breakdowns like “PM2.5: 78 | O₃: 45 | NO₂: 31,” those are the individual sub-indices. The overall AQI displayed is simply the largest of those numbers.
AQI Breakpoints
Breakpoints are the specific pollutant concentration values that mark the boundaries between AQI categories. The EPA establishes breakpoints based on the National Ambient Air Quality Standards (NAAQS) and a review of health effects evidence.
An AQI value of 100 for any pollutant corresponds exactly to that pollutant’s short-term NAAQS standard — the legal threshold set to protect public health. This is why AQI 100 is considered the boundary between “satisfactory” and “beginning of concern.”
NowCast AQI
The standard AQI is designed for daily reporting, based on 24-hour or 8-hour pollutant averages. But for real-time reporting — the “current AQI” you see on an app right now — agencies use the NowCast.
The NowCast is the EPA’s endorsed algorithm for converting short-term (hourly) monitor readings into an AQI value that’s meaningful in the moment. Rather than a simple hourly average, the NowCast uses a weighted average of recent hours, giving more weight to the most recent data. When air quality is rapidly changing — such as during a wildfire or sudden pollution event — the NowCast adjusts its time window to reflect conditions more responsively.
In practical terms: whenever you see “current air quality” on AirNow, a weather app, or a real-time widget, that value was calculated using the NowCast algorithm.
AQI Forecast
An AQI forecast predicts what air quality will be at a future point in time — typically the next 24–48 hours. Forecasts are generated using meteorological data, emissions inventories, atmospheric chemistry models, and historical patterns. They help people plan outdoor activities in advance, rather than reacting to current conditions.
Forecast accuracy decreases with distance in time — a same-day forecast is far more reliable than a 3-day forecast. Many apps display both current (NowCast) AQI and forecast AQI side by side.
National Ambient Air Quality Standards (NAAQS)
The NAAQS are the legal air quality standards set by the U.S. EPA under the Clean Air Act. They define the maximum allowable concentrations of six “criteria pollutants” — PM2.5, PM10, ozone, NO₂, SO₂, and CO — in outdoor air.
Primary NAAQS are health-based standards designed to protect the public, including sensitive groups. Secondary NAAQS protect environmental and public welfare values such as visibility, crops, and ecosystems. The AQI is designed around primary NAAQS — an AQI of 100 corresponds to a pollutant hitting its primary standard threshold.
Part 2: The Six Core AQI Pollutants
PM2.5 — Fine Particulate Matter
What it is: Particulate matter with an aerodynamic diameter of 2.5 micrometers or smaller — roughly 1/30th the diameter of a human hair. PM2.5 is not a single substance but a mixture of solid particles and liquid droplets suspended in air, including dust, soot, smoke, organic chemicals, and metals.
Where it comes from: Primarily, combustion generates PM2.5—from vehicle engines, power plants, industrial facilities, wood burning, wildfires, and even cooking. Beyond these direct sources, however, the atmosphere also produces PM2.5 secondarily, through chemical reactions that transform gases like SO₂ and NO₂ into fine particles.
Why it matters: Indeed, PM2.5 ranks as the most dangerous of the common air pollutants. Because of its microscopic size, it penetrates deep into the lungs, bypasses the body’s natural filtration systems, and even enters the bloodstream. Furthermore, long-term exposure links directly to heart disease, stroke, lung cancer, and reduced lung function. In the short term, however, it still triggers respiratory irritation, sparks coughing, and aggravates both asthma and cardiovascular conditions.
Measurement unit: Micrograms per cubic meter (µg/m³), typically as a 24-hour average.
AQI breakpoints (US EPA):
- Good: 0–9.0 µg/m³
- Moderate: 9.1–35.4 µg/m³
- Unhealthy for Sensitive Groups: 35.5–55.4 µg/m³
- Unhealthy: 55.5–125.4 µg/m³
- Very Unhealthy: 125.5–225.4 µg/m³
- Hazardous: 225.5+ µg/m³
PM10 — Coarse Particulate Matter
What it is: Particulate matter with an aerodynamic diameter of 10 micrometers or smaller, including the fine PM2.5 fraction plus larger coarse particles (2.5–10 µm). PM10 includes dust, pollen, mold spores, and particles from crushing or grinding operations.
Where it comes from: Road dust, construction sites, agricultural operations, mining, windblown soil, and pollen. Unlike PM2.5, coarse particles are primarily mechanically generated rather than formed from combustion.
Why it matters: PM10 particles are larger and are more efficiently filtered by the nose and throat. They typically deposit in the upper respiratory tract rather than the deep lungs. However, they still cause respiratory irritation, trigger asthma attacks, and aggravate existing lung conditions. People with asthma are particularly sensitive.
Measurement unit: µg/m³, typically as a 24-hour average.
AQI breakpoints (US EPA):
- Good: 0–54 µg/m³
- Moderate: 55–154 µg/m³
- Unhealthy for Sensitive Groups: 155–254 µg/m³
- Unhealthy: 255–354 µg/m³
- Very Unhealthy: 355–424 µg/m³
- Hazardous: 425+ µg/m³
O₃ — Ground-Level Ozone
What it is: Ozone (O₃) is a molecule composed of three oxygen atoms. While stratospheric ozone (the “ozone layer”) protects life from UV radiation, ground-level ozone is a harmful pollutant — the primary component of smog.
Where it comes from: Ground-level ozone is not directly emitted from any source. It forms when volatile organic compounds (VOCs) and nitrogen oxides (NOₓ) react in the presence of sunlight and heat. This is why ozone levels are highest on hot, sunny days and in the afternoon hours. Major precursor sources include vehicle exhaust, industrial emissions, gasoline vapors, and chemical solvents.
Why it matters: Ozone is a powerful oxidant that damages lung tissue even in healthy people. It causes chest tightness, coughing, shortness of breath, and inflammation of the airways. Repeated exposure can permanently scar lung tissue and reduce lung capacity. Athletes and outdoor workers are particularly exposed. It also damages crops, forests, and ecosystems.
Measurement unit: Parts per billion (ppb), typically as a maximum 8-hour average.
AQI breakpoints (US EPA):
- Good: 0–54 ppb
- Moderate: 55–70 ppb
- Unhealthy for Sensitive Groups: 71–85 ppb
- Unhealthy: 86–105 ppb
- Very Unhealthy: 106–200 ppb
- Hazardous: 201+ ppb (note: ozone levels this high are extremely rare)
NO₂ — Nitrogen Dioxide
What it is: Nitrogen dioxide is a reddish-brown gas with a sharp, biting odor that is part of the nitrogen oxides (NOₓ) family. It is both a direct health hazard and a key precursor to ground-level ozone and secondary particulate matter.
Where it comes from: The burning of fossil fuels at high temperatures — primarily vehicle engines, power plants, industrial boilers, and aircraft. NO₂ concentrations are highest near busy roads and in urban areas with heavy traffic. Indoor sources include gas stoves, furnaces, and kerosene heaters.
Why it matters: NO₂ irritates the airways and increases susceptibility to respiratory infections. Long-term exposure is associated with development of asthma, particularly in children. It also contributes to the formation of fine particles and ozone, compounding its health and environmental impacts.
Measurement unit: ppb, typically as a 1-hour average.
AQI breakpoints (US EPA):
- Good: 0–53 ppb
- Moderate: 54–100 ppb
- Unhealthy for Sensitive Groups: 101–360 ppb
- Unhealthy: 361–649 ppb
- Very Unhealthy: 650–1249 ppb
- Hazardous: 1250+ ppb
SO₂ — Sulfur Dioxide
What it is: Sulfur dioxide is a colorless gas with a sharp, acrid smell. It is one of the oldest-recognized air pollutants and was the primary cause of the deadly London smog episodes of the 20th century.
Where it comes from: The burning of sulfur-containing fossil fuels — primarily coal and oil — in power plants and industrial facilities. Metal smelting and volcanic eruptions are also major sources. In areas with heavy coal burning or industrial activity, SO₂ can be a dominant air quality concern.
Why it matters: SO₂ is a respiratory irritant that affects the upper airways. Even short-term exposure can trigger bronchoconstriction in people with asthma, sometimes within minutes. Longer-term exposure contributes to chronic bronchitis, reduced lung function, and cardiovascular disease. SO₂ also reacts in the atmosphere to form fine sulfate particles (a component of PM2.5), contributing to haze and acid rain.
Measurement unit: ppb, typically as a 1-hour average.
AQI breakpoints (US EPA):
- Good: 0–35 ppb
- Moderate: 36–75 ppb
- Unhealthy for Sensitive Groups: 76–185 ppb
- Unhealthy: 186–304 ppb
- Very Unhealthy: 305–604 ppb
- Hazardous: 605+ ppb
CO — Carbon Monoxide
What it is: Carbon monoxide is a colorless, odorless, tasteless gas produced by the incomplete combustion of carbon-based fuels. Because it cannot be detected by human senses, it is sometimes called “the silent killer” — though outdoor CO levels that reach dangerous concentrations are rare in most environments.
Where it comes from: Vehicle exhaust is the dominant outdoor source, which is why CO concentrations are highest near highways, in tunnels, and in congested urban areas. Industrial facilities, wildfires, and power plants also contribute. Indoors, major sources include gas stoves, furnaces, water heaters, fireplaces, and portable generators.
Why it matters: CO binds to hemoglobin in the blood with an affinity approximately 200 times greater than oxygen, forming carboxyhemoglobin. This prevents blood from carrying oxygen to organs and tissues. Even at moderate concentrations, CO reduces oxygen delivery to the heart and brain, worsening cardiovascular conditions and impairing neurological function. At high concentrations — which are primarily a concern indoors — CO causes headaches, dizziness, confusion, and can be fatal.
Measurement unit: Parts per million (ppm), typically as a maximum 8-hour average.
AQI breakpoints (US EPA):
- Good: 0–4.4 ppm
- Moderate: 4.5–9.4 ppm
- Unhealthy for Sensitive Groups: 9.5–12.4 ppm
- Unhealthy: 12.5–15.4 ppm
- Very Unhealthy: 15.5–30.4 ppm
- Hazardous: 30.5+ ppm
Part 3: Additional Pollutants & Related Terms
CO₂ — Carbon Dioxide
What it is: Carbon dioxide is the well-known greenhouse gas produced by the combustion of fossil fuels, respiration, and decomposition. It is important to note that CO₂ is not part of the standard outdoor AQI calculation. At outdoor ambient concentrations (currently around 420–425 ppm globally as of 2026), CO₂ does not pose a direct acute health hazard in the way the other AQI pollutants do.
CO₂ becomes a direct health concern in indoor environments where poor ventilation allows levels to climb significantly above outdoor concentrations. Indoor CO₂ above 1,000 ppm is associated with reduced cognitive function, drowsiness, and headaches. Above 5,000 ppm, it poses serious health risks.
CO₂ is included in Indoor Air Quality Index (IAQI) calculations and is monitored by indoor air quality sensors, even though it is absent from the outdoor EPA AQI formula. Its primary significance for most people is as a climate change driver and as an indoor ventilation indicator.
VOC / TVOC — Volatile Organic Compounds
What they are: Volatile organic compounds are a broad class of carbon-containing chemicals that easily evaporate at room temperature, releasing gases into the air. TVOC (Total VOC) is a cumulative measure of all VOCs present in a given air sample.
Where they come from outdoors: Vehicle exhaust, industrial emissions, solvents, paints, and gasoline vapors. Biogenic VOCs from trees and plants (especially isoprene and terpenes) also contribute significantly to atmospheric chemistry — and play a major role in ozone formation.
Where they come from indoors: Paints, varnishes, adhesives, cleaning products, air fresheners, carpets, building materials, and office equipment. Indoor TVOC levels frequently exceed outdoor levels by 2–5 times.
Why they matter: VOCs are a key precursor to ground-level ozone formation. Some VOCs — such as benzene, formaldehyde, and toluene — are directly toxic or carcinogenic. TVOC monitoring is standard in indoor air quality assessment, though TVOCs are not part of the outdoor AQI formula.
Pb — Lead
What it is: Lead is a heavy metal that, when airborne, occurs as fine particles that can be inhaled or ingested. Lead is one of the six EPA “criteria pollutants” regulated under NAAQS but is monitored separately from the standard AQI due to its different exposure dynamics (assessed as a rolling 3-month average rather than a daily value).
Where it comes from: Lead was historically the dominant air pollutant from leaded gasoline until the phase-out in the 1970s–1990s. Today, primary sources include smelting facilities, aviation gasoline (still used in small propeller aircraft), battery manufacturing, and some industrial processes.
Why it matters: Lead has no known safe level of exposure. It accumulates in the body over time and causes irreversible neurological damage, particularly in children — affecting cognitive development, behavior, and learning. Lead air quality has improved dramatically since the leaded gasoline ban but remains a concern near specific industrial sites.
Ultrafine Particles (UFP / PM0.1)
What they are: Particles smaller than 0.1 micrometers (100 nanometers) in diameter. These are even smaller than PM2.5 and are not yet part of the standard regulatory AQI, but are an active area of air quality research.
Why they matter: Ultrafine particles can penetrate not just into the deep lungs but directly into the bloodstream and potentially into the brain. Their tiny size also means they carry a larger surface area relative to mass, which increases their ability to carry toxic chemicals. Major sources include traffic, combustion, and cooking. Scientists and regulators increasingly consider UFPs a significant future concern for AQI frameworks.
Formaldehyde (HCHO)
What it is: A colorless, strong-smelling gas that is both naturally occurring and synthetic. While primarily an indoor air quality concern, formaldehyde is also present outdoors from vehicle exhaust and industrial emissions.
Why it matters: Formaldehyde is classified as a human carcinogen by the International Agency for Research on Cancer (IARC). Short-term exposure causes eye, nose, and throat irritation. Indoors, it is released from pressed wood products, adhesives, certain insulation materials, and household products. It is monitored in indoor air quality assessments but is not part of the standard outdoor AQI.
Ozone Precursors (NOₓ and VOCs)
These are not pollutants that directly enter the AQI calculation, but understanding them explains why ozone forms where and when it does.
NOₓ (Nitrogen Oxides) is the collective term for nitric oxide (NO) and nitrogen dioxide (NO₂) — primarily from combustion processes. VOCs react with NOₓ in the presence of sunlight to form ground-level ozone. This is why ozone is worst on hot, sunny, calm days in urban areas — all the ingredients (NOₓ from traffic, VOCs from industry and vegetation, sunlight, heat) come together.
Controlling ozone means reducing either NOₓ or VOC emissions — or both.
Acid Rain
A downstream consequence of SO₂ and NOₓ emissions. When these gases react with water vapor, oxygen, and other chemicals in the atmosphere, they form sulfuric acid and nitric acid, which fall as acid rain (or acid snow, fog, and dry deposition). Acid rain damages forests, acidifies lakes, corrodes buildings and infrastructure, and harms aquatic ecosystems. While not an AQI metric itself, it is a significant environmental consequence of the same pollutants that drive poor air quality.
Smog
Smog is a visible form of air pollution — a hazy, yellowish-brown atmospheric condition produced primarily by a combination of ground-level ozone, particulate matter, and other pollutants. The term originally described the combination of smoke and fog in industrial cities. Modern urban smog is predominantly photochemical smog — formed by the reaction of sunlight with NOₓ and VOCs from vehicle exhaust and industry. High AQI days in urban areas often correlate with visible smog.
Haze
Haze is reduced atmospheric visibility caused by particulate matter — primarily fine particles (PM2.5) that scatter and absorb light. Unlike smog, haze can occur far from pollution sources as particles travel long distances on wind currents. Wildfire smoke frequently causes haze thousands of miles from the fire itself. Haze is both an air quality and visibility concern, and is measured using the Haziness Index or Standard Visual Range (SVR).
Wildfire Smoke AQI
Wildfire smoke creates unique air quality challenges. It is dominated by PM2.5 from wood combustion and can elevate AQI to hazardous levels hundreds or even thousands of miles from the fire. Standard low-cost air sensors can be less accurate during wildfire smoke events; the EPA recommends using the Fire and Smoke Map (fire.airnow.gov) and applying a smoke-adjusted correction factor for low-cost sensor readings during smoke events.
Temperature Inversion
A meteorological phenomenon that significantly worsens air quality. Normally, air temperature decreases with altitude, allowing warm air near the surface (along with its pollutants) to rise and disperse. During a temperature inversion, a layer of warm air sits above cooler surface air, acting as a lid that traps pollutants near the ground. Temperature inversions are common in mountain valleys, coastal cities, and during calm winter nights, and are a primary cause of AQI spikes that persist for days.
Sensitive Groups
The AQI defines sensitive groups as populations who are at greater risk of health effects from air pollution than healthy adults. These include:
- People with asthma, COPD, or other lung diseases
- People with heart disease or cardiovascular conditions
- Older adults (generally 65+)
- Children and teenagers (lungs still developing)
- Pregnant women
- People with diabetes
- Outdoor workers with prolonged heavy exertion exposure
- People of lower socioeconomic status (often have higher exposure and less access to protective measures)
For sensitive groups, health concerns begin at lower AQI thresholds — typically at the “Moderate” (51–100) level rather than “Unhealthy for Sensitive Groups” (101–150).
Part 4: Global AQI Systems
The U.S. EPA AQI is widely used internationally and is the basis for many global air quality apps, but different countries and regions use their own systems with different scales, pollutants, and breakpoints.
| System | Region | Key Difference |
|---|---|---|
| US AQI (EPA) | United States | 0–500 scale; 6 categories; the global de facto standard |
| CAQI | Europe (until 2017) | Common Air Quality Index; 0–100 scale; 5 categories |
| EAQI | European Union (current) | European Air Quality Index; 6 bands; uses European standards |
| AQI (MEP) | China | Similar 0–500 scale but different breakpoints, especially below 200 |
| AQHI | Canada | Air Quality Health Index; 1–10+ scale; health risk focused |
| API | Malaysia / Singapore | Air Pollution Index / Pollutant Standards Index; 0–500 scale |
| AQI (CPCB) | India | 0–500 scale; 8 pollutants including NH₃ and Pb |
Important: The same raw PM2.5 concentration can produce different AQI numbers under different national systems. This is why the same city can show different AQI values on different apps if they use different calculation standards. Always check which standard an app or device uses.
Part 5: IAQI — Indoor Air Quality Index
The Indoor Air Quality Index (IAQI) applies AQI-style thinking to indoor environments. Indoor air quality is often worse than outdoor air quality — indoor pollutant levels can be 2–5 times higher — yet most people spend 90% of their time indoors.
The IAQI typically includes pollutants not in the outdoor AQI formula: CO₂, TVOCs, formaldehyde, and humidity. It is measured by indoor air quality monitors and smart home sensors. Unlike the outdoor AQI (where higher = worse), some IAQI implementations invert the scale so higher = better.
Key indoor pollutant sources: cooking, cleaning products, building materials, furniture, inadequate ventilation, and infiltration of outdoor pollution.
Part 6: How to Check AQI
There are several reliable ways to access AQI data:
Official Government Sources:
- AirNow.gov (US) — Real-time and forecast AQI for all US cities
- CPCB India — Central Pollution Control Board AQI portal
- European Environment Agency — EAQI for all EU countries
Global Apps & Platforms:
- IQAir / AirVisual — Comprehensive global real-time AQI
- Breezometer — Used by many major weather apps as their AQI data source
- PurpleAir — Community sensor network; useful for hyperlocal readings
Integrated Weather Platforms: Many weather apps now include AQI data alongside temperature and precipitation forecasts. The quality of this data depends on their data provider.
Your Own Website: If you run a website — for health, fitness, travel, environmental education, real estate, news, or any audience that spends time outdoors — you can embed a live, real-time AQI display directly on your pages so your visitors never have to look elsewhere.
🌤️ Display Live AQI on Your WordPress Website
Understanding AQI is the first step. Having access to it — in real time, for your specific location, every single day — is what actually changes behavior and protects health.
Location Weather serves over 20,000+ WordPress websites, and it lets you embed beautiful, real-time AQI and weather data on any page, post, or sidebar. Moreover, this plugin requires no coding skills, nor does it burden you with complex API setups. Consequently, you can deliver working, live air quality data to your visitors effortlessly—and it simply works right out of the box.
AQI Features in Location Weather:
🌤️ AQI Minimal Card Block: A clean, compact real-time Air Quality Index display for any location worldwide. Shows the current AQI number, category, and color indicator. Drop it in your sidebar, footer, or any page. Perfect for health blogs, fitness sites, school websites, and environmental platforms.
🌤️ AQI Detailed Air Quality Block: The full picture: individual pollutant breakdowns (PM2.5, PM10, O₃, NO₂, SO₂, CO), real-time health recommendations per AQI category, and pollutant-specific status — everything covered in this guide, displayed live for your audience.
🌤️ Historical Air Quality Data Block: Show long-term AQI trends for any location. Ideal for environmental research sites, real estate platforms (“see the 12-month air quality trend for this neighborhood”), and journalism.
🌤️ Hourly & Daily AQI Forecast: Let your visitors plan outdoor activities days in advance — not just react to today’s conditions.
🌤️ Auto-Detect Visitor Location: The plugin automatically detects each visitor’s location and shows them their own local AQI — no manual city search needed. Every visitor gets personalized air quality data the moment they land on your page.
Also Included with Location Weather:
- 200,000+ cities across 238+ countries
- Full weather forecasts (current, hourly, 7-day)
- Weather maps and Windy radar integration
- AI weather assistant — visitors can ask weather and AQI questions in plain language
- Works with Gutenberg, Elementor, Divi, WPBakery, and all major page builders
- 200+ ready-to-use weather and AQI widget templates
- Compatible with all major themes (Astra, Divi, Avada, OceanWP, Neve, GeneratePress, and more)
Who Should Use Location Weather’s AQI Features:
| Website Type | How AQI Helps Your Audience |
|---|---|
| 🏃 Fitness & Running blogs | Help readers decide whether to exercise outdoors |
| 🧒 Parenting & Family sites | Let parents check conditions before school drop-off |
| 🏥 Health & Medical platforms | Give patients real-time data to manage asthma, COPD |
| ✈️ Travel & Tourism sites | Show destination air quality alongside weather |
| 🏫 School & Community sites | Help administrators make outdoor recess decisions |
| 🌿 Environmental blogs | Provide real-time data alongside your editorial content |
| 🏘️ Real Estate websites | Show neighborhood air quality trends to homebuyers |
| 📰 Local news portals | Deliver daily AQI as a public service |
Get Started Today
👉 Install Location Weather Free on WordPress.org Includes the AQI Minimal Card block — live in minutes, no credit card needed
👉 See All AQI Block Demos Live previews of every AQI block — free and pro
👉 Explore Location Weather Pro Unlock full pollutant breakdowns, historical AQI, forecasts & auto-detect location
👉 Read the Documentation Step-by-step setup guides for every block and feature
Quick Reference: AQI Terms Glossary
| Term | Definition |
|---|---|
| AQI | Air Quality Index — 0–500 scale measuring overall outdoor air pollution |
| PM2.5 | Fine particles ≤2.5µm; most dangerous common pollutant |
| PM10 | Coarser particles ≤10µm; includes PM2.5 plus larger particles |
| O₃ | Ground-level ozone; the main component of smog |
| NO₂ | Nitrogen dioxide; from combustion; ozone precursor |
| SO₂ | Sulfur dioxide; from coal burning; respiratory irritant |
| CO | Carbon monoxide; colorless, odorless combustion byproduct |
| CO₂ | Carbon dioxide; greenhouse gas; indoor air quality indicator |
| VOC / TVOC | Volatile organic compounds; ozone precursors; indoor health concern |
| NOₓ | Nitrogen oxides (NO + NO₂); combustion byproducts; ozone precursors |
| Pb | Lead; heavy metal; monitored separately from standard AQI |
| UFP / PM0.1 | Ultrafine particles; not yet in standard AQI; emerging concern |
| Sub-Index (Individual AQI / IAQI) | Individual AQI; sub-index for a single pollutant |
| NowCast | Real-time AQI algorithm using weighted hourly averages |
| NAAQS | National Ambient Air Quality Standards; US legal air quality thresholds |
| AQI Breakpoints | Concentration boundaries that define AQI category transitions |
| Sensitive Groups | Populations at elevated risk: asthma, heart disease, elderly, children |
| Temperature Inversion | Meteorological event that traps pollutants near ground level |
| Smog | Visible photochemical air pollution; ozone + particulates + NOₓ |
| Haze | Reduced visibility from fine particle scattering of light |
| Acid Rain | Atmospheric consequence of SO₂ and NOₓ; damages ecosystems |
| EAQI | European Air Quality Index; EU standard equivalent to US AQI |
| AQHI | Air Quality Health Index; Canada’s 1–10+ health-focused scale |
| Indoor AQI / IAQI | Air quality index adapted for indoor environments |
| Beyond the AQI | AQI values exceeding 500; extreme events only |
Information in this article is sourced from the U.S. Environmental Protection Agency (EPA), the American Lung Association, the World Health Organization (WHO), and peer-reviewed environmental health literature. For medical advice specific to your health condition, consult a qualified healthcare professional.


Leave a Reply